Demand Driven Forecasting
A forecasting report in manufacturing is a critical tool that helps businesses predict future demand for their product items. This process involves analyzing historical data, market trends, and other factors to estimate how much product will be needed in the future.
To access the Forecasting Report, go to: Home > Manufacturing.
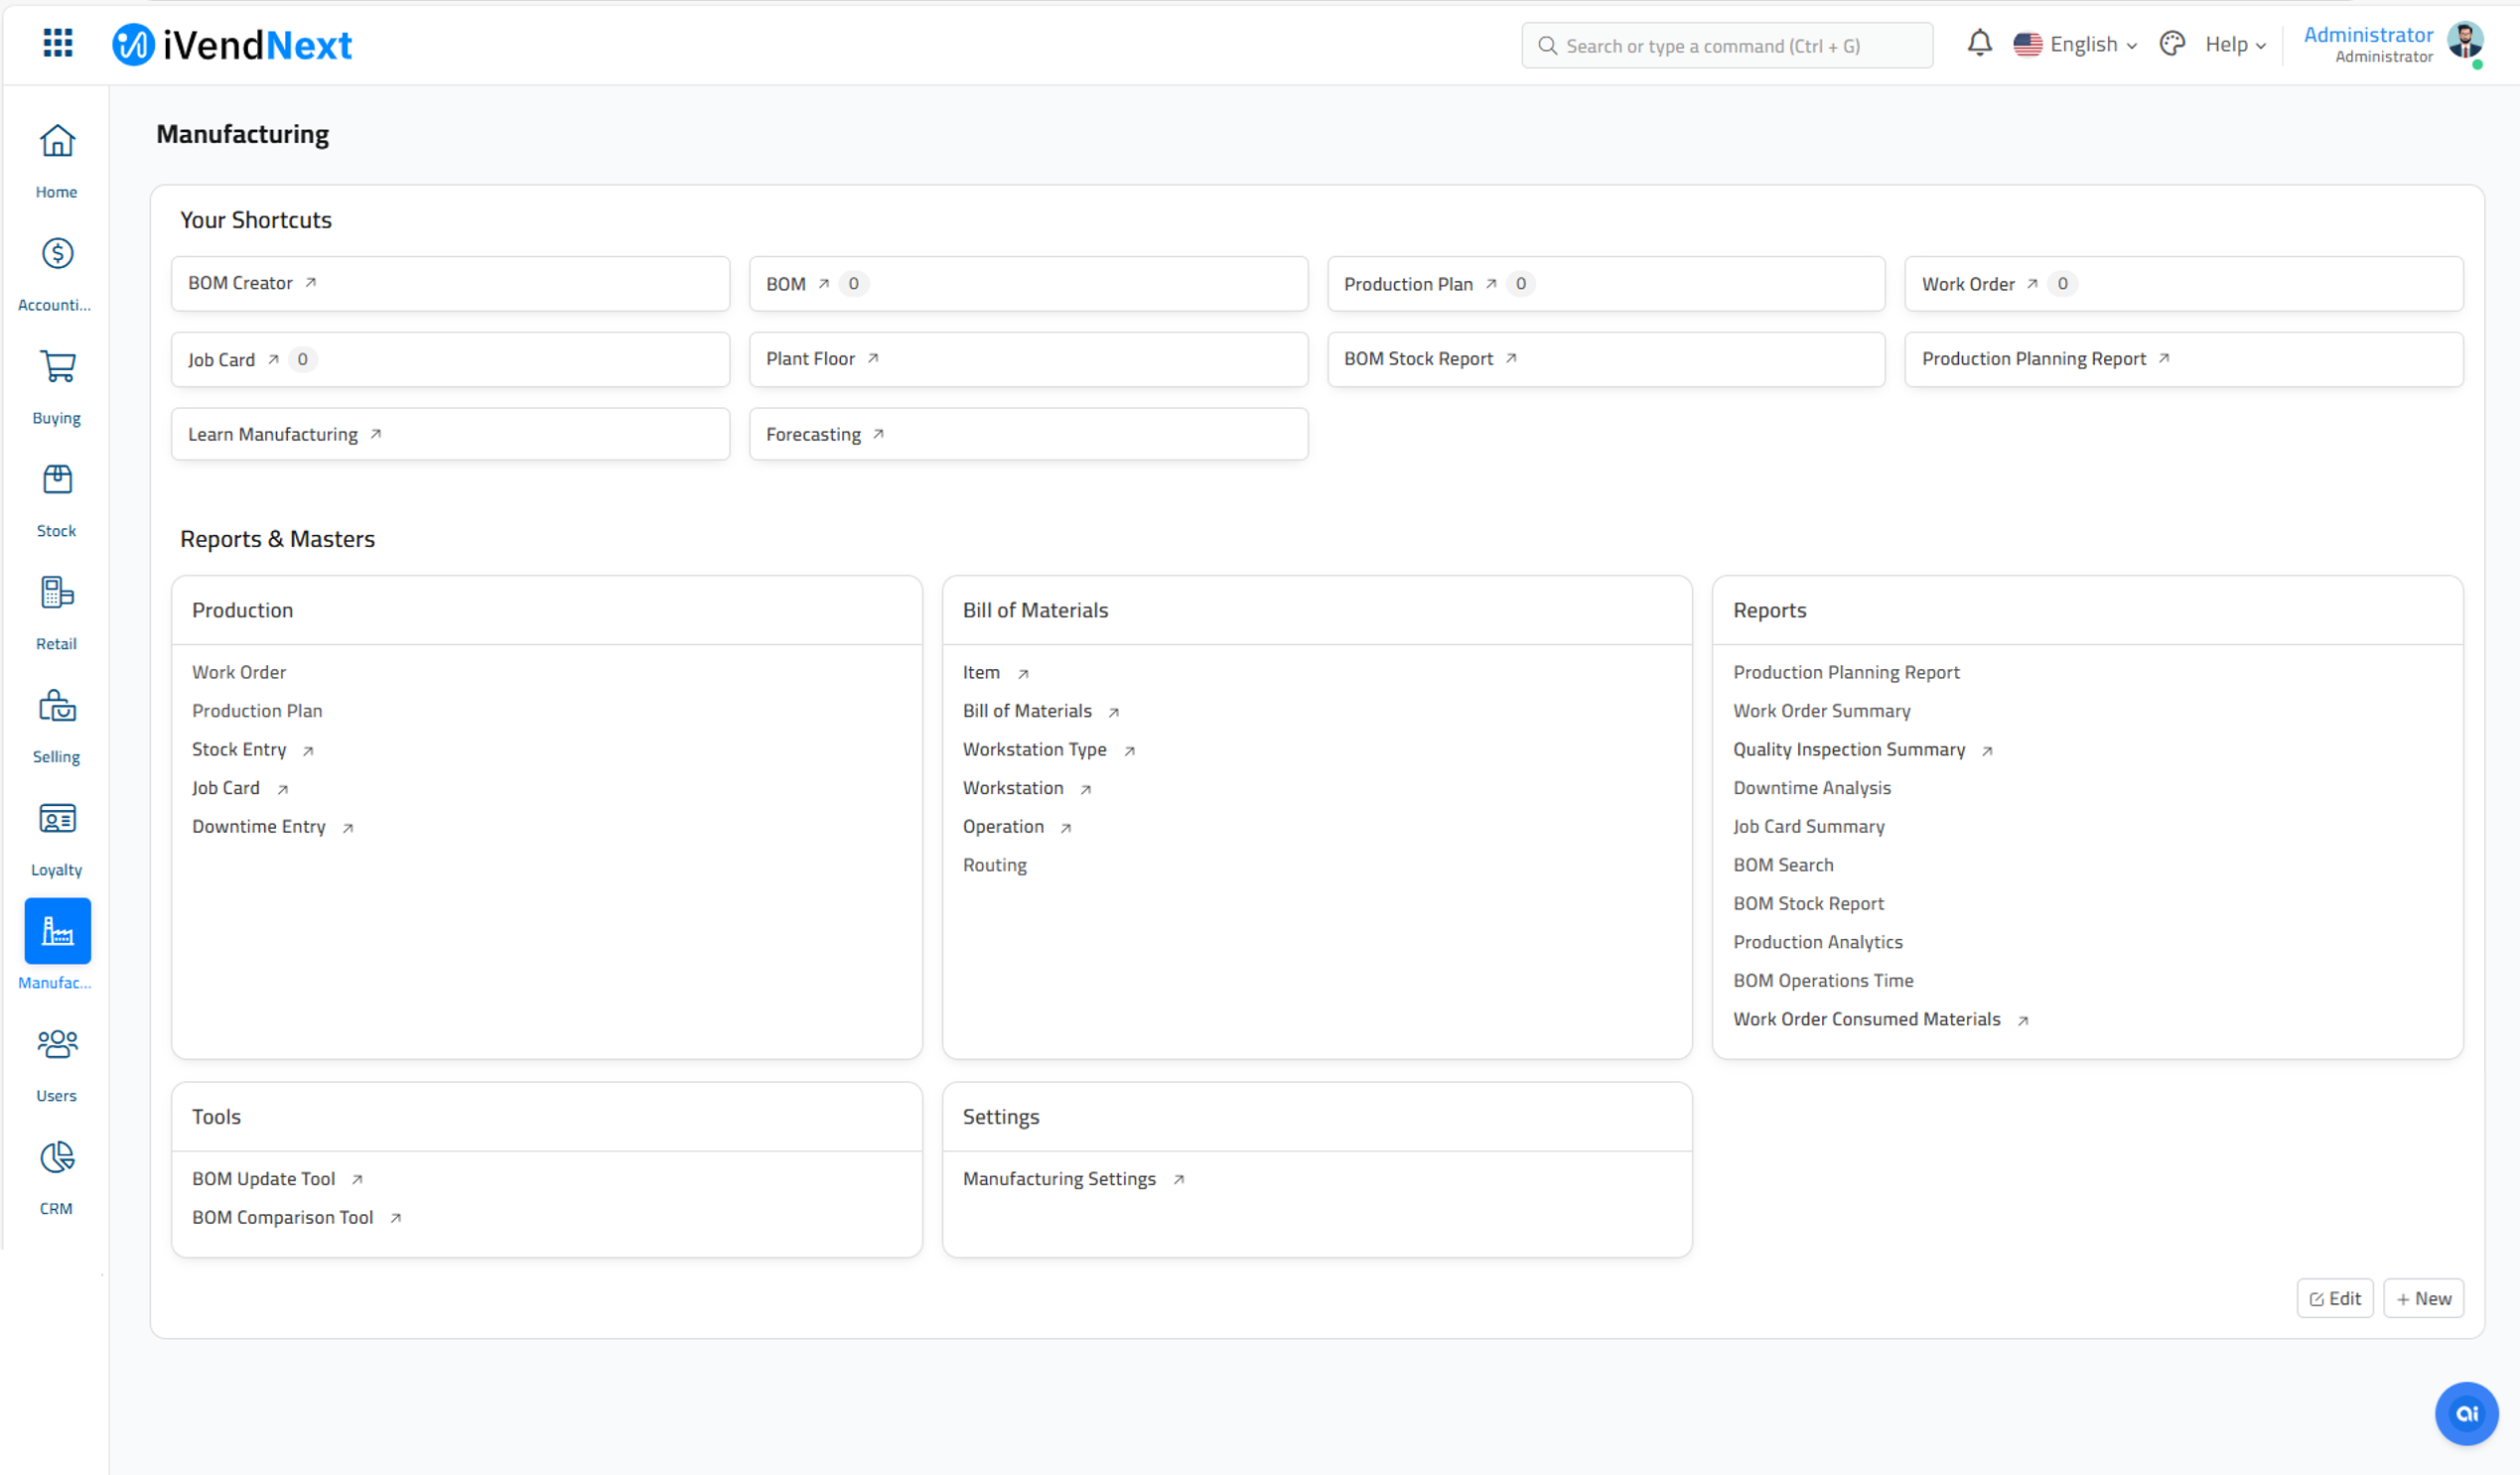
Then under the Reports Section click on the Forecasting shortcut.
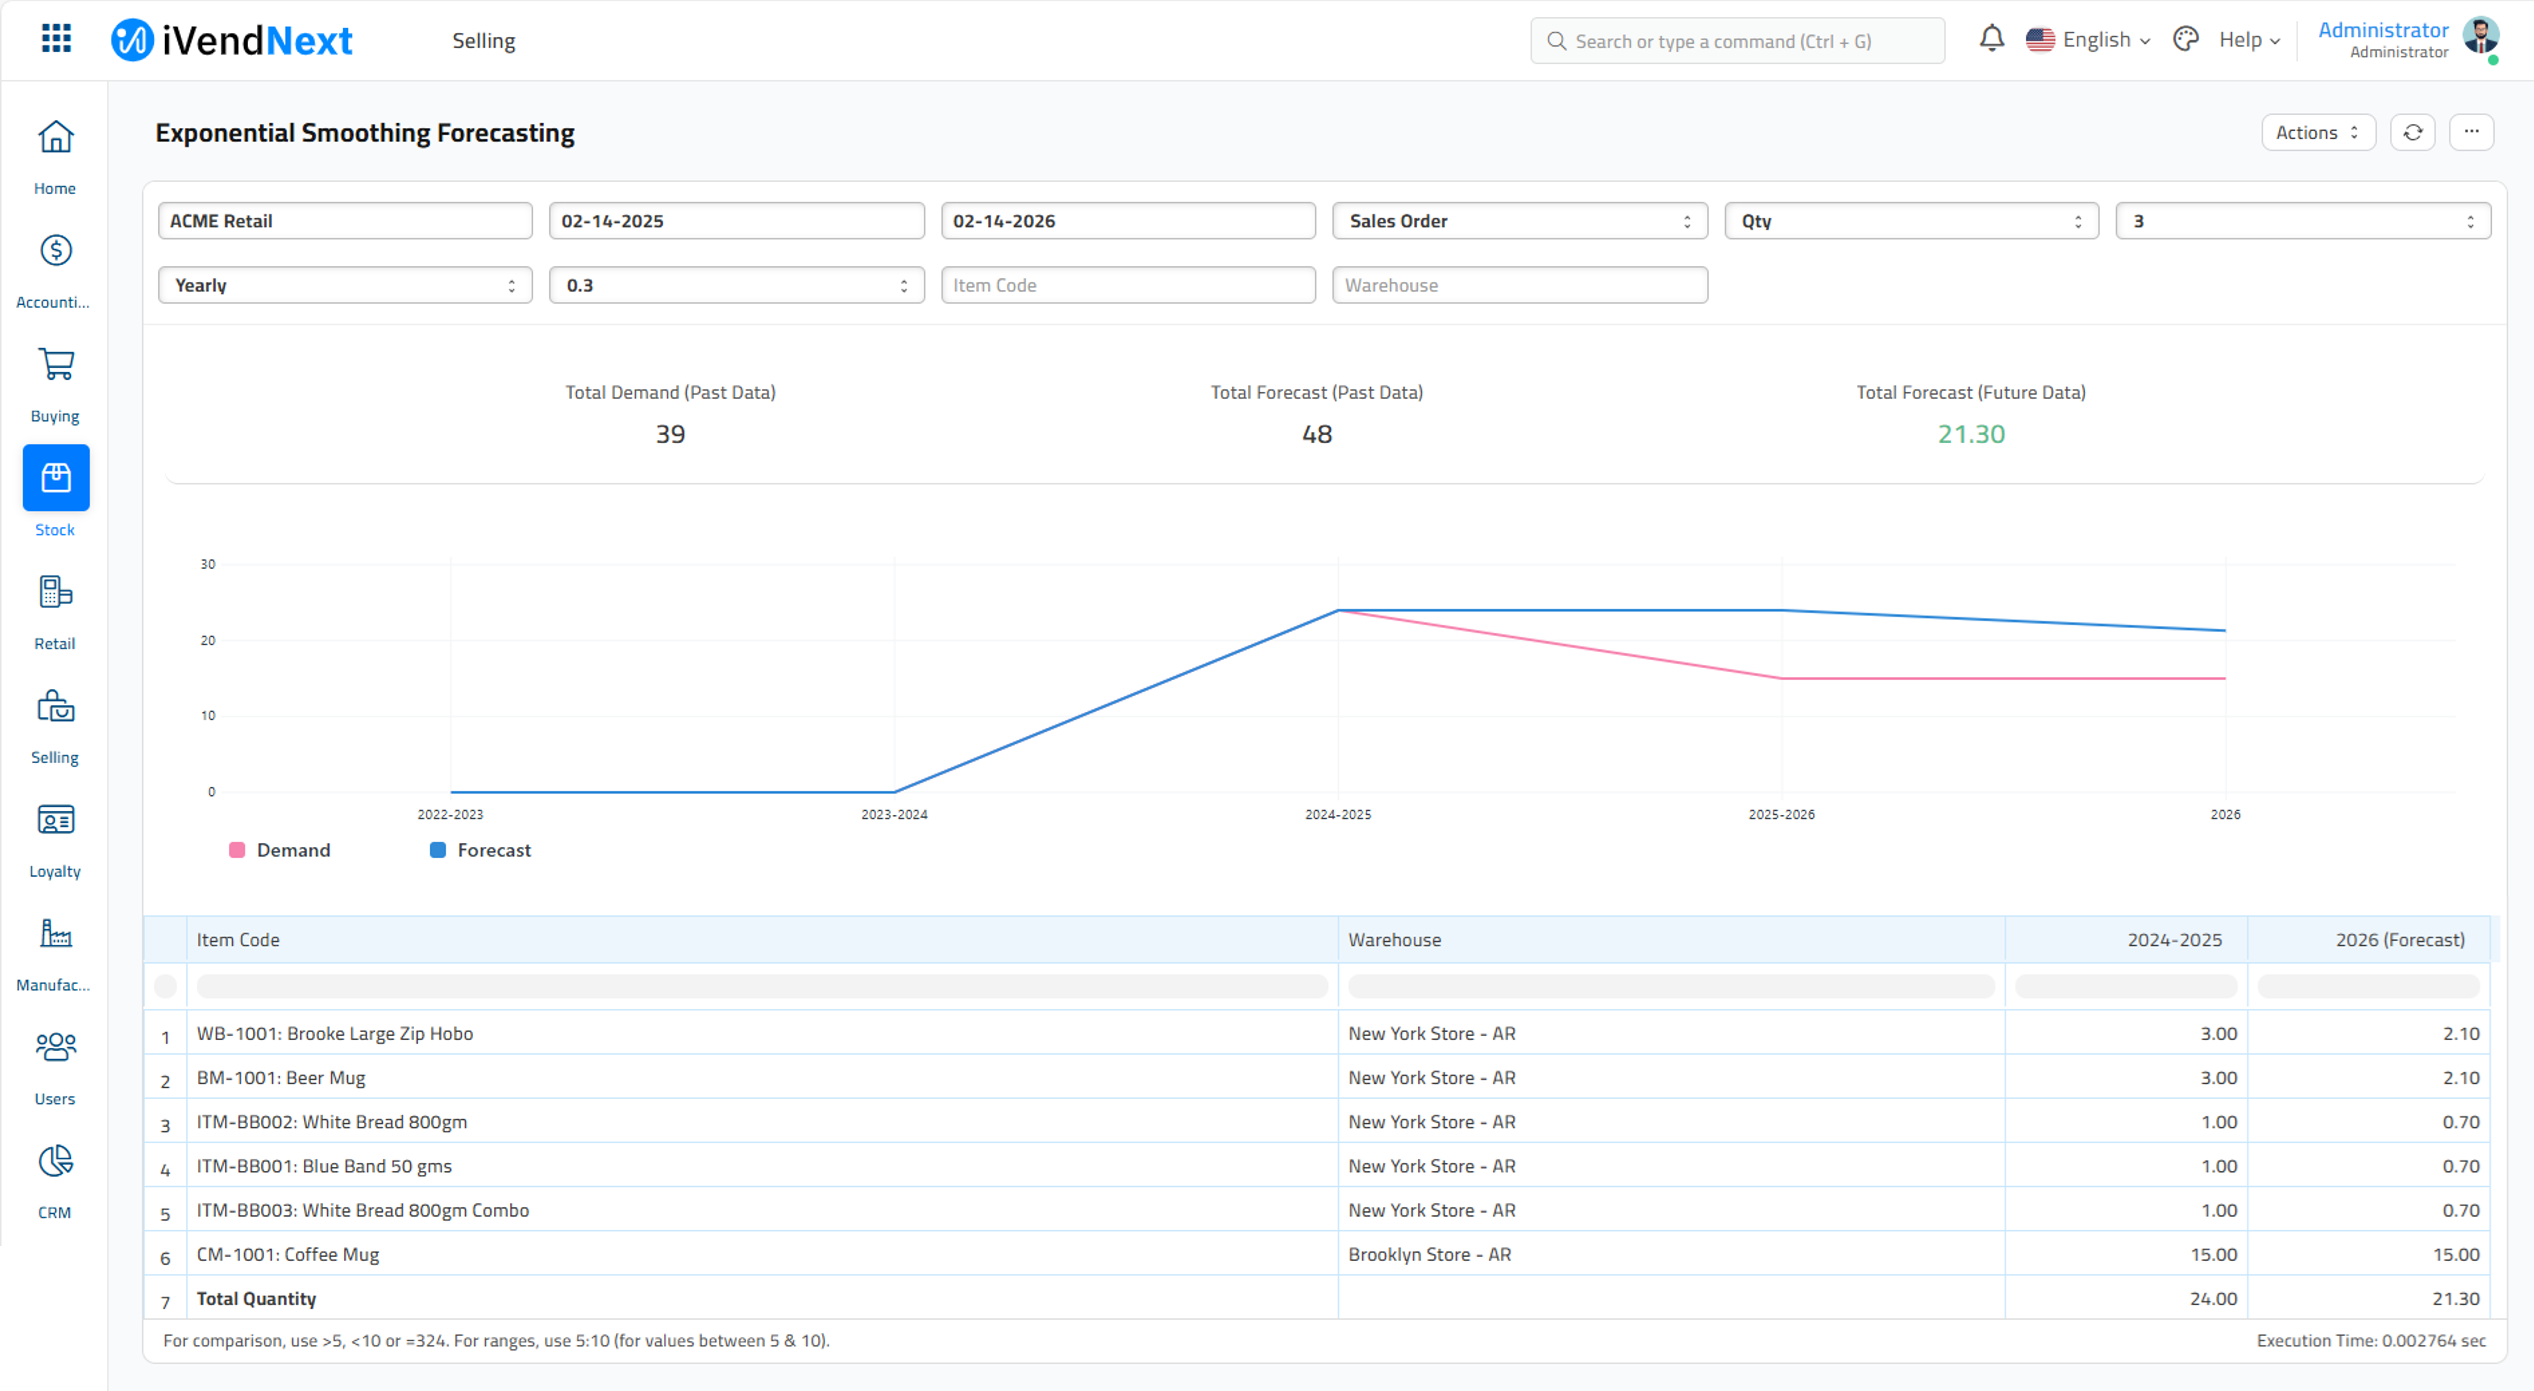
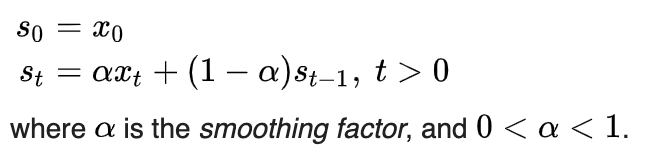
Using exponential smoothing method and past Sales Order / Delivery Note / Quotation data, the forecasting will be calculated. The exponential smoothing method formula is as below:
Using the exponential smoothing method, the system predicts the forecasting for each period and the same forecast data will be used to forecast the upcoming period data.
How does the exponential smoothing method works
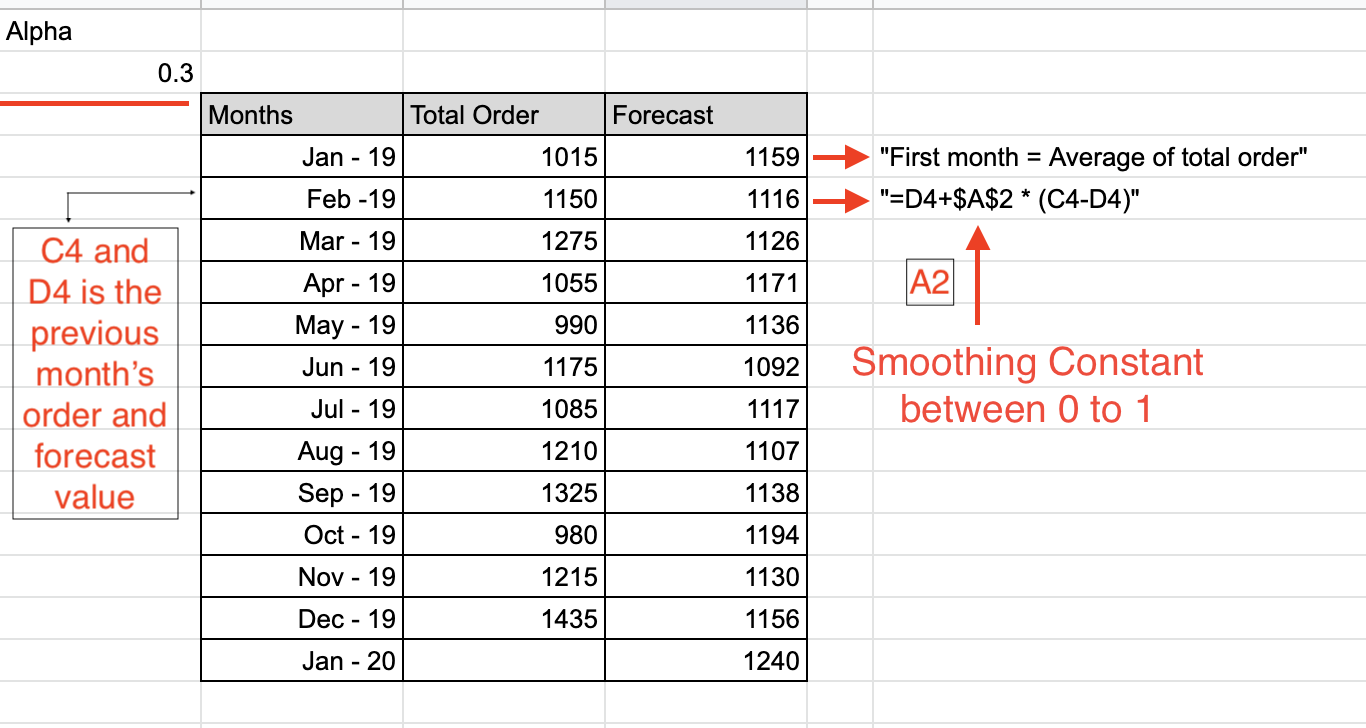
For the above example, we have used one-year sales order data every month. The first-month forecast will be calculated based on the average of all total orders. From the second month onward, the difference between the last month's Total Order and Forecast Value will be multiplied with the Smoothing Constant Value (in between 0 to 1). The default value of the Smoothing Constant is 0.3 which gives efficient forecasting data. Last month's Total Order and Forecast Value difference is called forecasting error and this error will be added in the same month of forecast value to calculate the forecast of the next month.
How do the filters work
Company :- user can do forecasting for the specific company by applying the company filter
From Date and To Date :- for this period the system will do the forecasting, the default from date is the current date and to date will be the one year ahead date from the current date.
Based On Document :- by default system uses sales order past data to forecast. User can select the other document like delivery note / quotation to forecast the data.
Based On :- based on quantity / amount the system shows the forecast data.
Based On Data ( in years ) :- for forecasting requires past data, this filter helps the system to check past data for a number of years.
Periodicity :- forecasting data can be viewed in Monthly / Quarterly / Half-Yearly / Yearly basis, the old forecast data can not be displayed for Monthly period for better view.
Smoothing Constant - the Smoothing Constant will be used to forecast the data, the value should be between 0 and 1.